Real World Measurements

Building on our foundation of electrical knowledge from Modcon Fall 2010, RWM helped develop my skills in measurements and analyzing circuits. In this class we learned about how things work, from EKGs to Fourier transforms, by going through the process of building the circuitry and writing MATLAB code for our labs. We also had a large, 6-week group project where we chose the types of measurements we wanted to take and constructed a device to do so. Many of my peers built interesting devices like EEGs and wall-vibration sensors. My team conducted a weather balloon test.
RWM Group Project: Journey to the Atmosphere (via a Weather Balloon)
My team decided we were going to measure three things: altitude, temperature, and global position using a GPS. Using a system designed for first-person video systems (FPV) on hobby airplanes made by RC Logger, we had the options of measuring multiple temperatures and would be able to see the flight path on Google Earth. Initially we wanted to build our own measuring circuits, however we soon realized that would drive our costs up and would be harder and more time consuming to design something instead of just buying cheap-off-the-shelf (COTS) sensors. We decided to take data using a Data Acquisition Device (DAQ) that one of our professors, Brad Minch, designed for our class to use. Together with our sensors from Digikey, we put together a system to compare with the one already available through RC Logger.
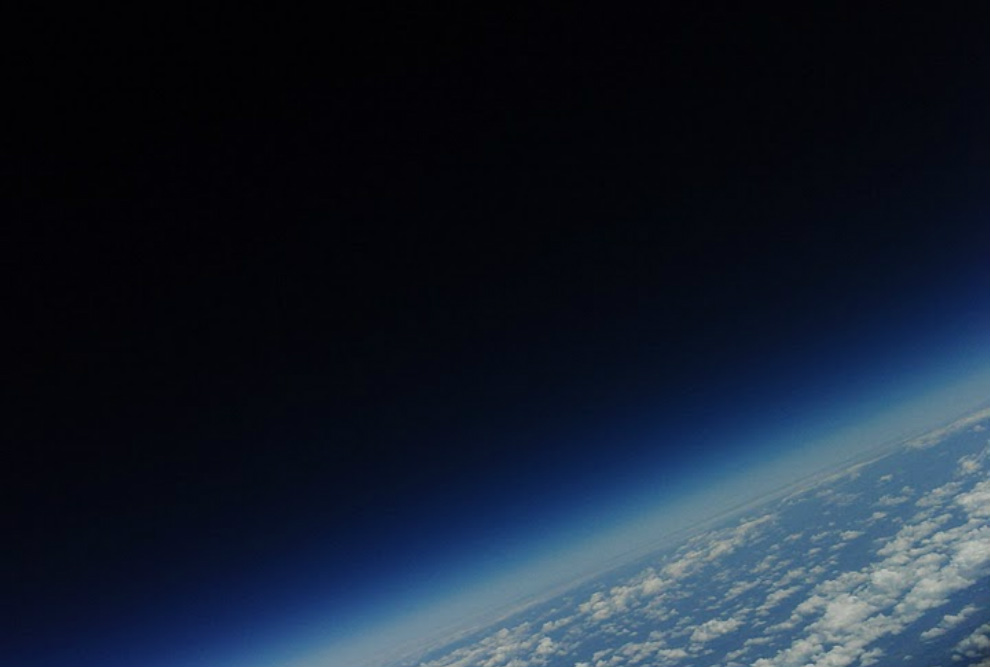
Along with our measurements, we also wanted to take pictures of the weather balloon's journey and used two cameras to accomplish that. The RC Logger camera and Hero headcam were on the side and bottom of the payload, respectively. One of our best aerial shots is shown below.

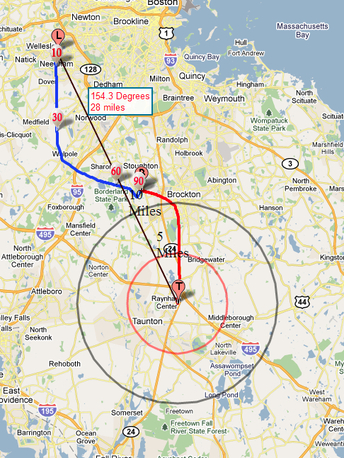
Successful launch date's flight path. The blue path shows the ascent and the red path shows the descent. The red circle shows where it was likely to land and the black circle shows the maximum range it could have ended up in. We were very lucky not to have landed in the ocean, or on a major freeway.
|
There were a few unexpected challenges we had that almost forced us to abandon the project. There were poor weather conditions during the last three weeks of the semester that forced us to change the launch date about 3-4 times. According to the various path simulation websites we used (nearspaceventures.com and onlinetesting.net), we needed a location fairly far west from the Olin campus in order not to land in the ocean. Generally the jet stream is so strong that within a flight time of 1.5 hours and a peak altitude of 100,000 ft, you could easily be blown more than 60 miles. Unfortunately, on our first launch attempt at Harvard University's forest in central Massachussetts, the balloon was released prematurely and no data was collected.
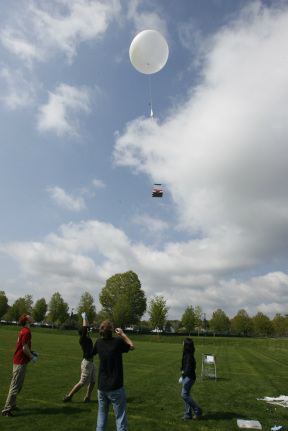
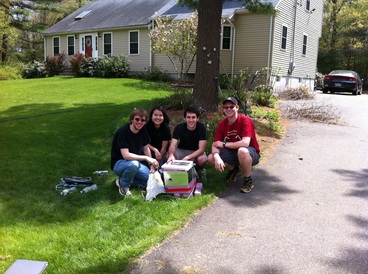
Fortunately, we were able to purchase a second weather balloon and had it shipped overnight to us. The weather cooperated on our second launch attempt giving us a good day with low winds. We were able to successfully launch our balloon from the Olin campus the weekend before finals and were able to launch and recover our weather balloon just as a storm was coming in. The winds were blowing south and we launched from Olin's campus and landed about 90 minutes later in a tree in someone's backyard in Taunton, MA, about 40 miles away, proving that our simulation data was very accurate. Luckily, an electrician lived across the street and lent us his ladder and electrician's pole to recover our payload. We were able to find our payload through a hacked cell phone that texted us its GPS coordinates. Our data from both the homemade device and RC logger matched almost perfectly, proving that the stock sensors available do work and are calibrated. The only issue we found was that it got too cold in the atmosphere for the sensors. Our equipment could not measure any temperature readings below -40 degrees F, so you can imagine how cold it was. Weather Balloon Specs: Reached an altitude of 100,000+ ft Cost: $200 for balloon, helium, and homemade circuit (everything else was scavenged or borrowed) Helpful links: Calculating flight trajectory: http://nearspaceventures.com/w3Baltrak/readyget.pl Calculating descent rate: http://www.onlinetesting.net/cgi-bin/descent3.3.cgi (ascent rate can be determined by the amount of helium in the tank) MIT's weather balloon: http://space.1337arts.com/ |


